US Almonds Market: Stable Prices, Shifting Sentiment, and Harvest Ahead
5 MIN READ
By Juan Ayala — July 20, 2026
Our Monthly Nuts Market Report blends real-time data with field insights to
support your private label retail strategy.
Want it monthly?
Sign up here
What’s Happening This Month?
By late June 2026, the California almond market changed significantly. At the end of the eleventh month of the sales year, there were far fewer almonds available than buyers expected.
California produces nearly 100% of the commercial almond supply in the United States and over the past four years, total shipments to domestic and global markets averaged 2.63 billion pounds. Normally, about 75% of these almonds are exported to major regions like Europe, India, and the Middle East, while the rest stay in the United States.
Because US farmers are removing trees, farming areas are shrinking, and water rules are stricter, the period of having too many almonds may be over.
An official report by Land IQ confirmed this change. The report showed that California’s active almond farmland decreased by 15,227 acres from last year, leaving a total of 1,385,870 acres for 2026.
Now, supply and demand are becoming balanced. This is changing how both buyers and growers think about the market.
Key Figures of the Almond Market (June 2026)
Cumulative Supply & Inventory Position (August 1 – June 30)
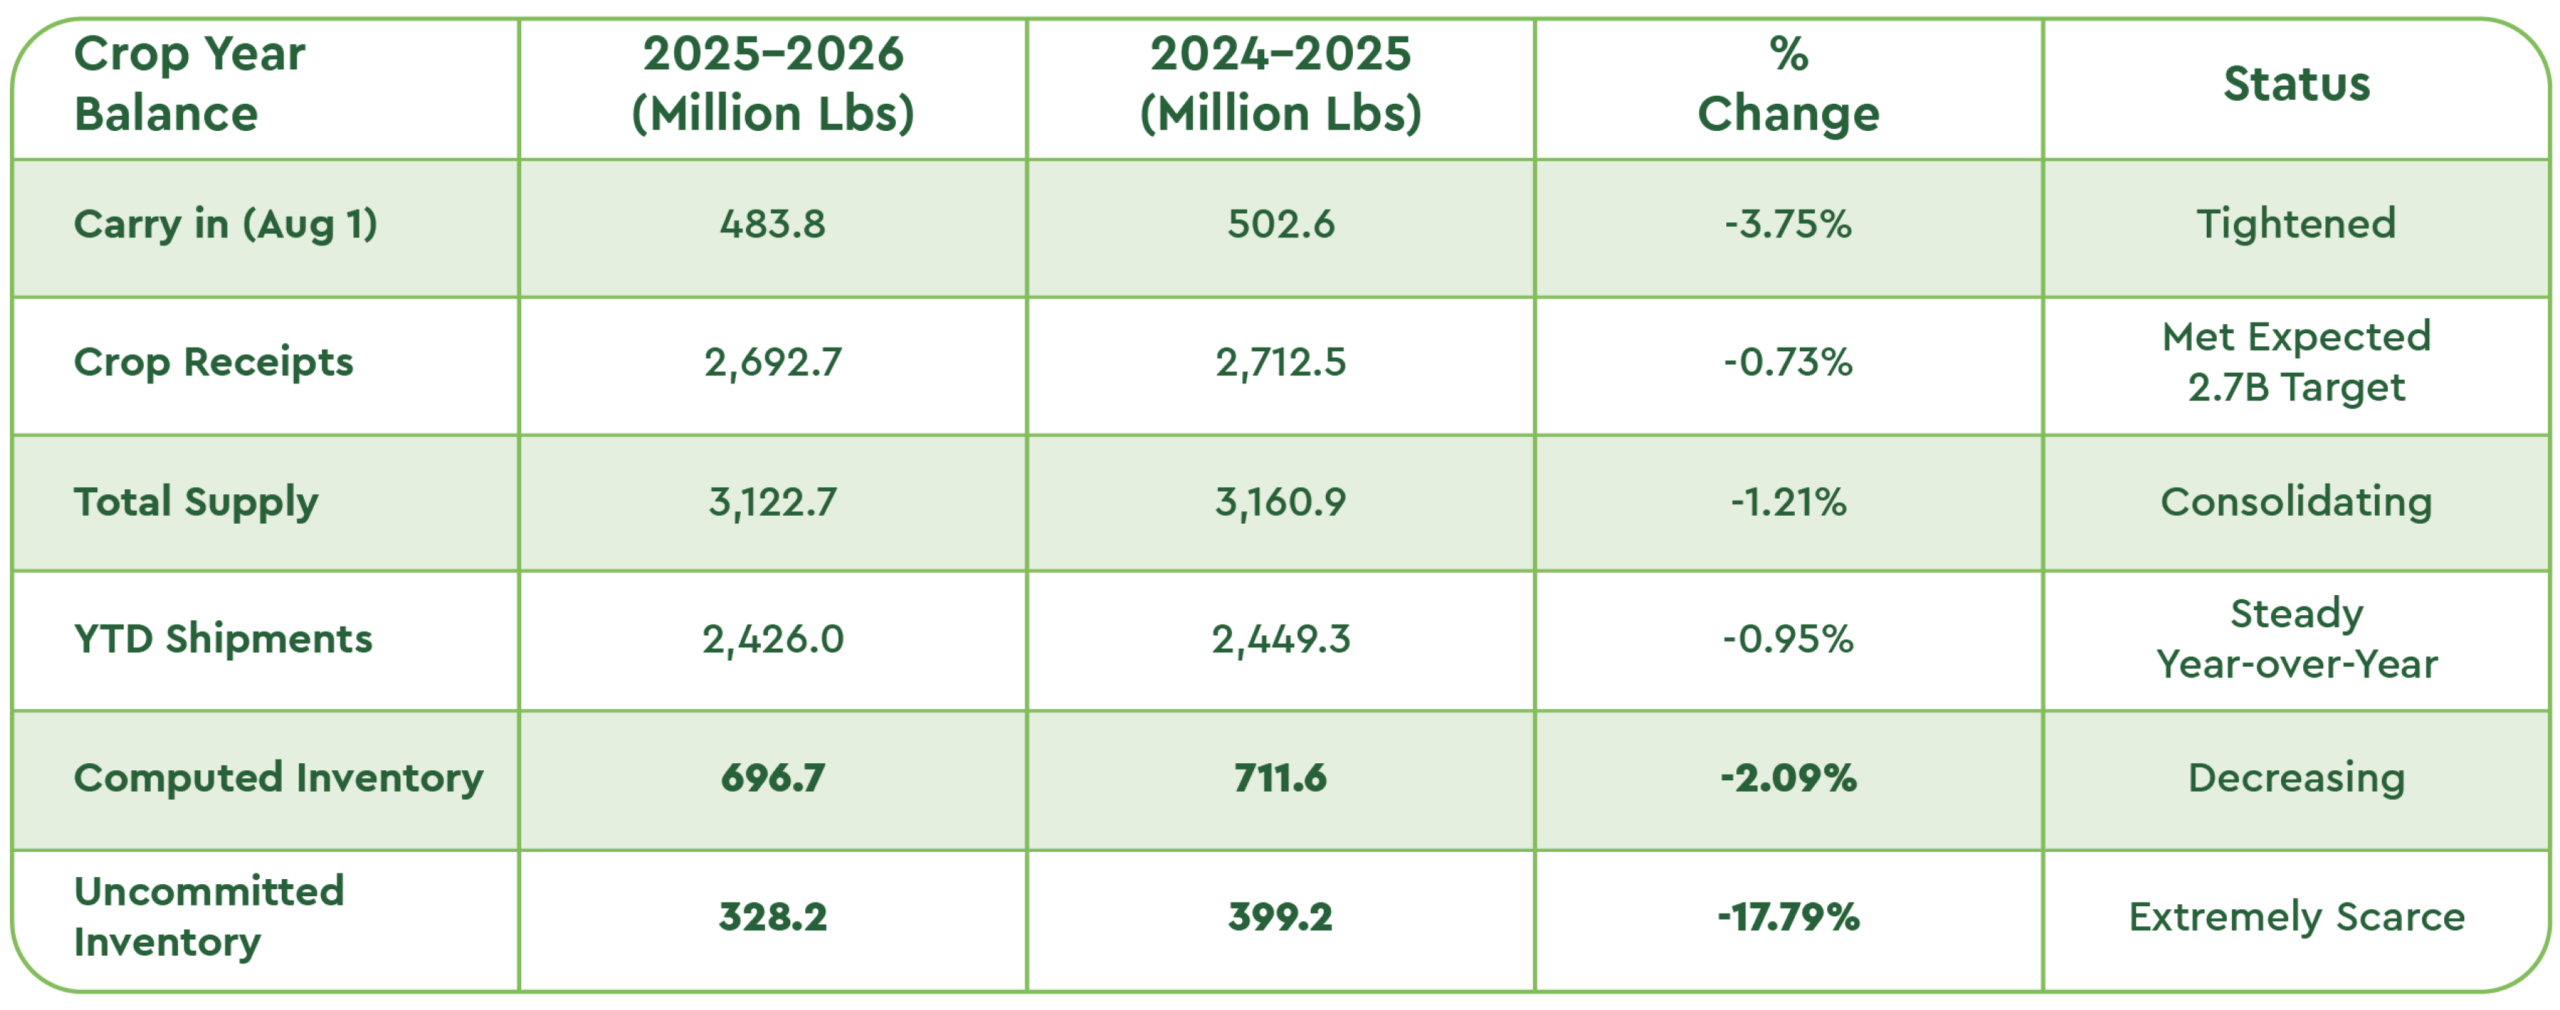
Source: Almond Board of California Position Report (Released July 2026)
June Shipment Highlights
- June Net Shipments: 212.98 million lbs vs. 186.73 million lbs in 2025 (+14.1% YoY).
- Domestic Shipments: 49.73 million lbs vs. 51.35 million lbs in 2025 (-3.1%).
- Export Shipments: 163.25 million lbs vs. 135.39 million lbs in 2025 (+20.6%).
California Standing Acreage & Orchard Removals (2026 Initial Estimates)
- Bearing Acreage: 1,385,870 acres.
- Removed Acreage: 47,588 acres (spatial analysis and predictive modelling as of March 31, 2026).
Key County-by-County Acreage Breakdown (Land IQ):
The structural footprint of the crop is highly consolidated in the Central and Southern regions of the valley, where acreage cuts are actively concentrated:
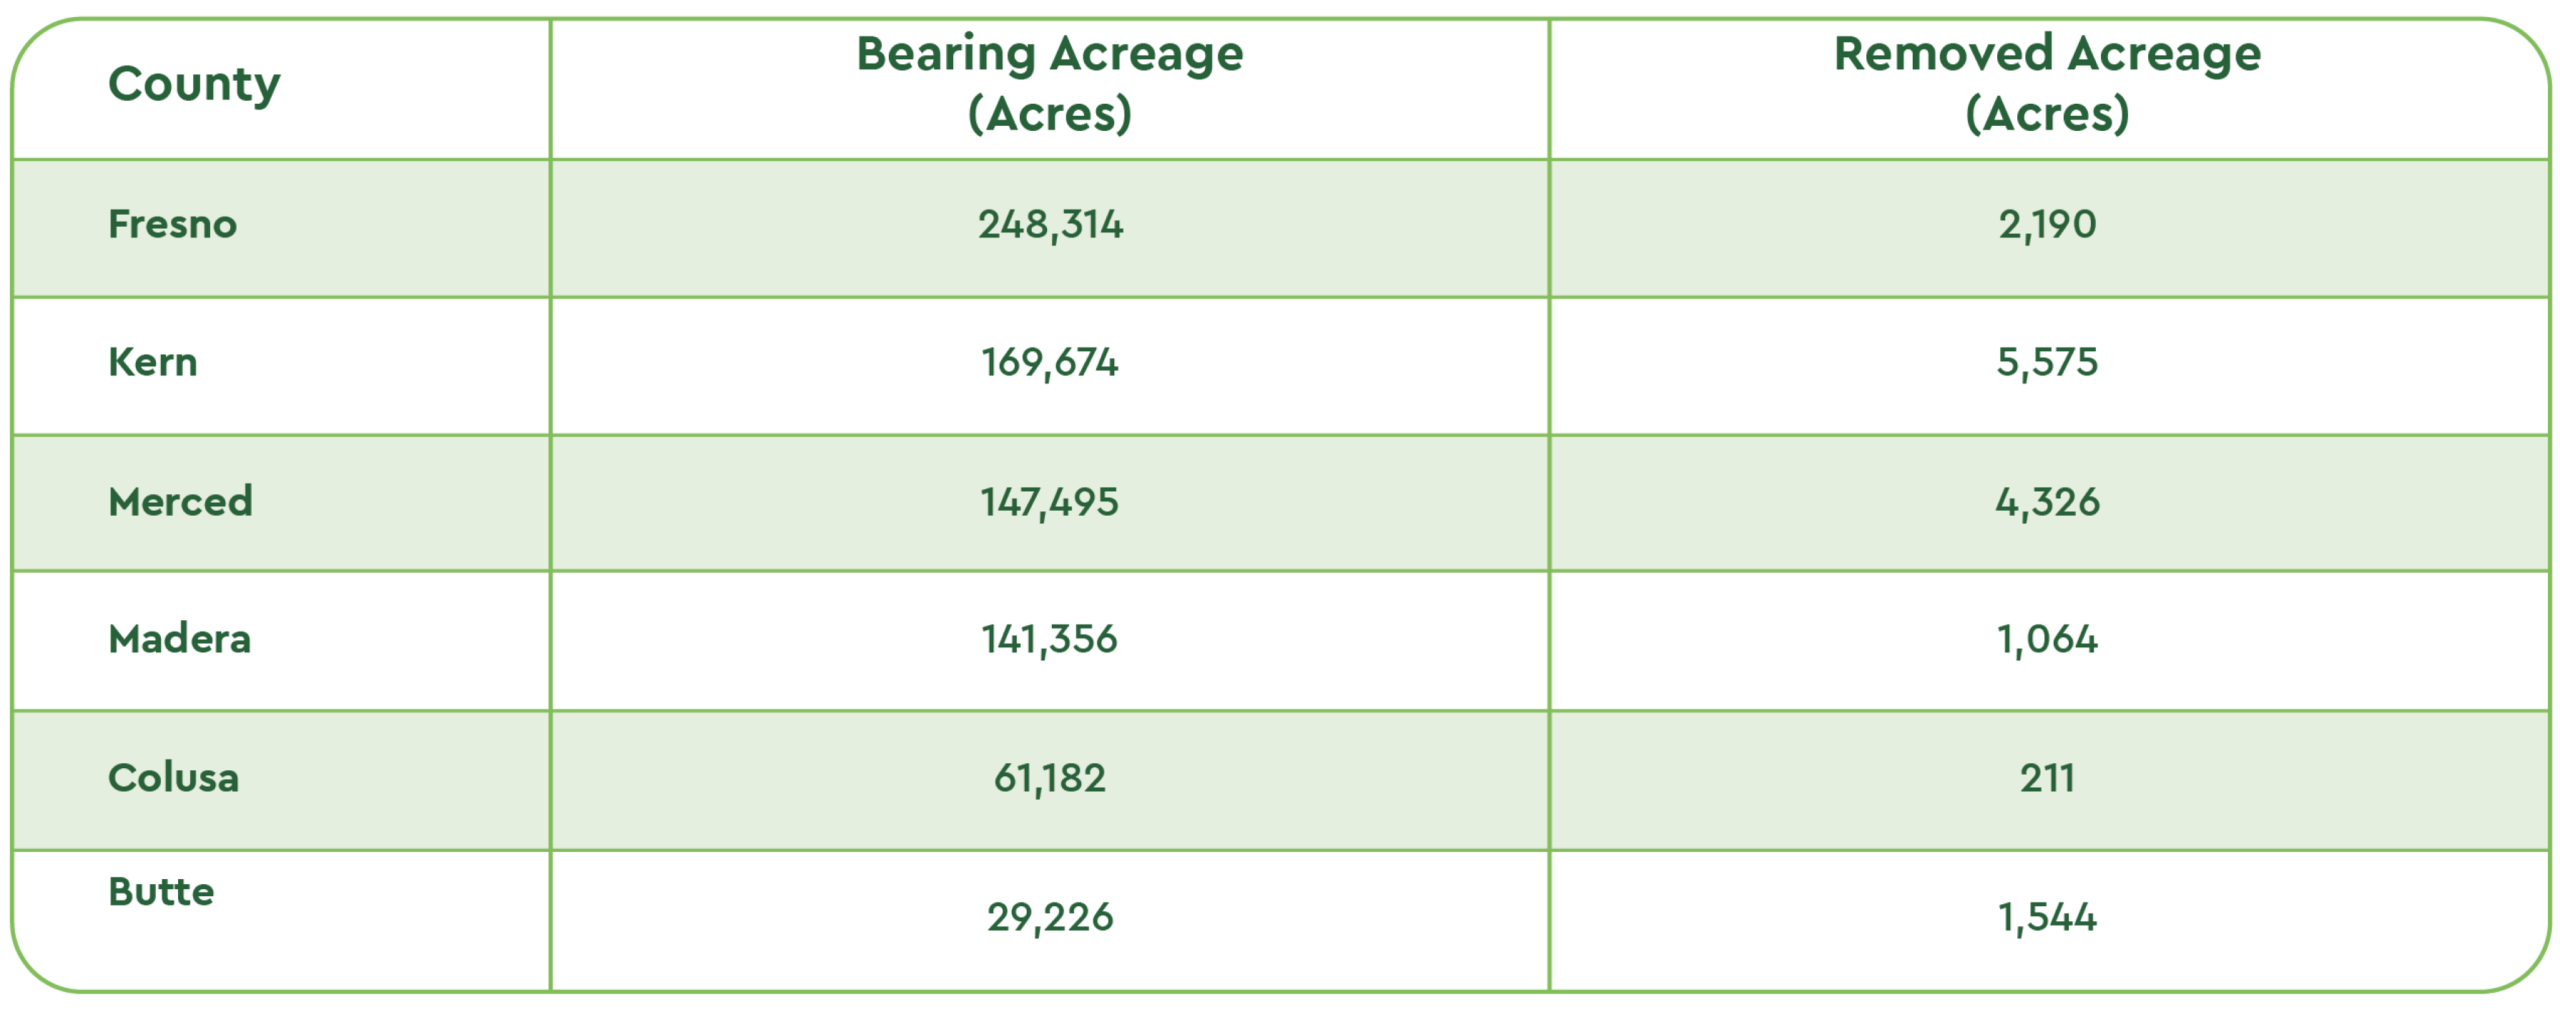
Source: Land IQ Standing Acreage – Initial Estimate (Released April 23, 2026)
Market Dynamics & Shifting Sentiment
Just-In-Time Spot Buying vs. New Crop Migration
The market is currently driven by immediate, short-term purchasing. Buyers only buy what they need for right now, and ask to receive the almonds almost as soon as they make a contract.
However, a massive divergence is occurring in new crop commitments:
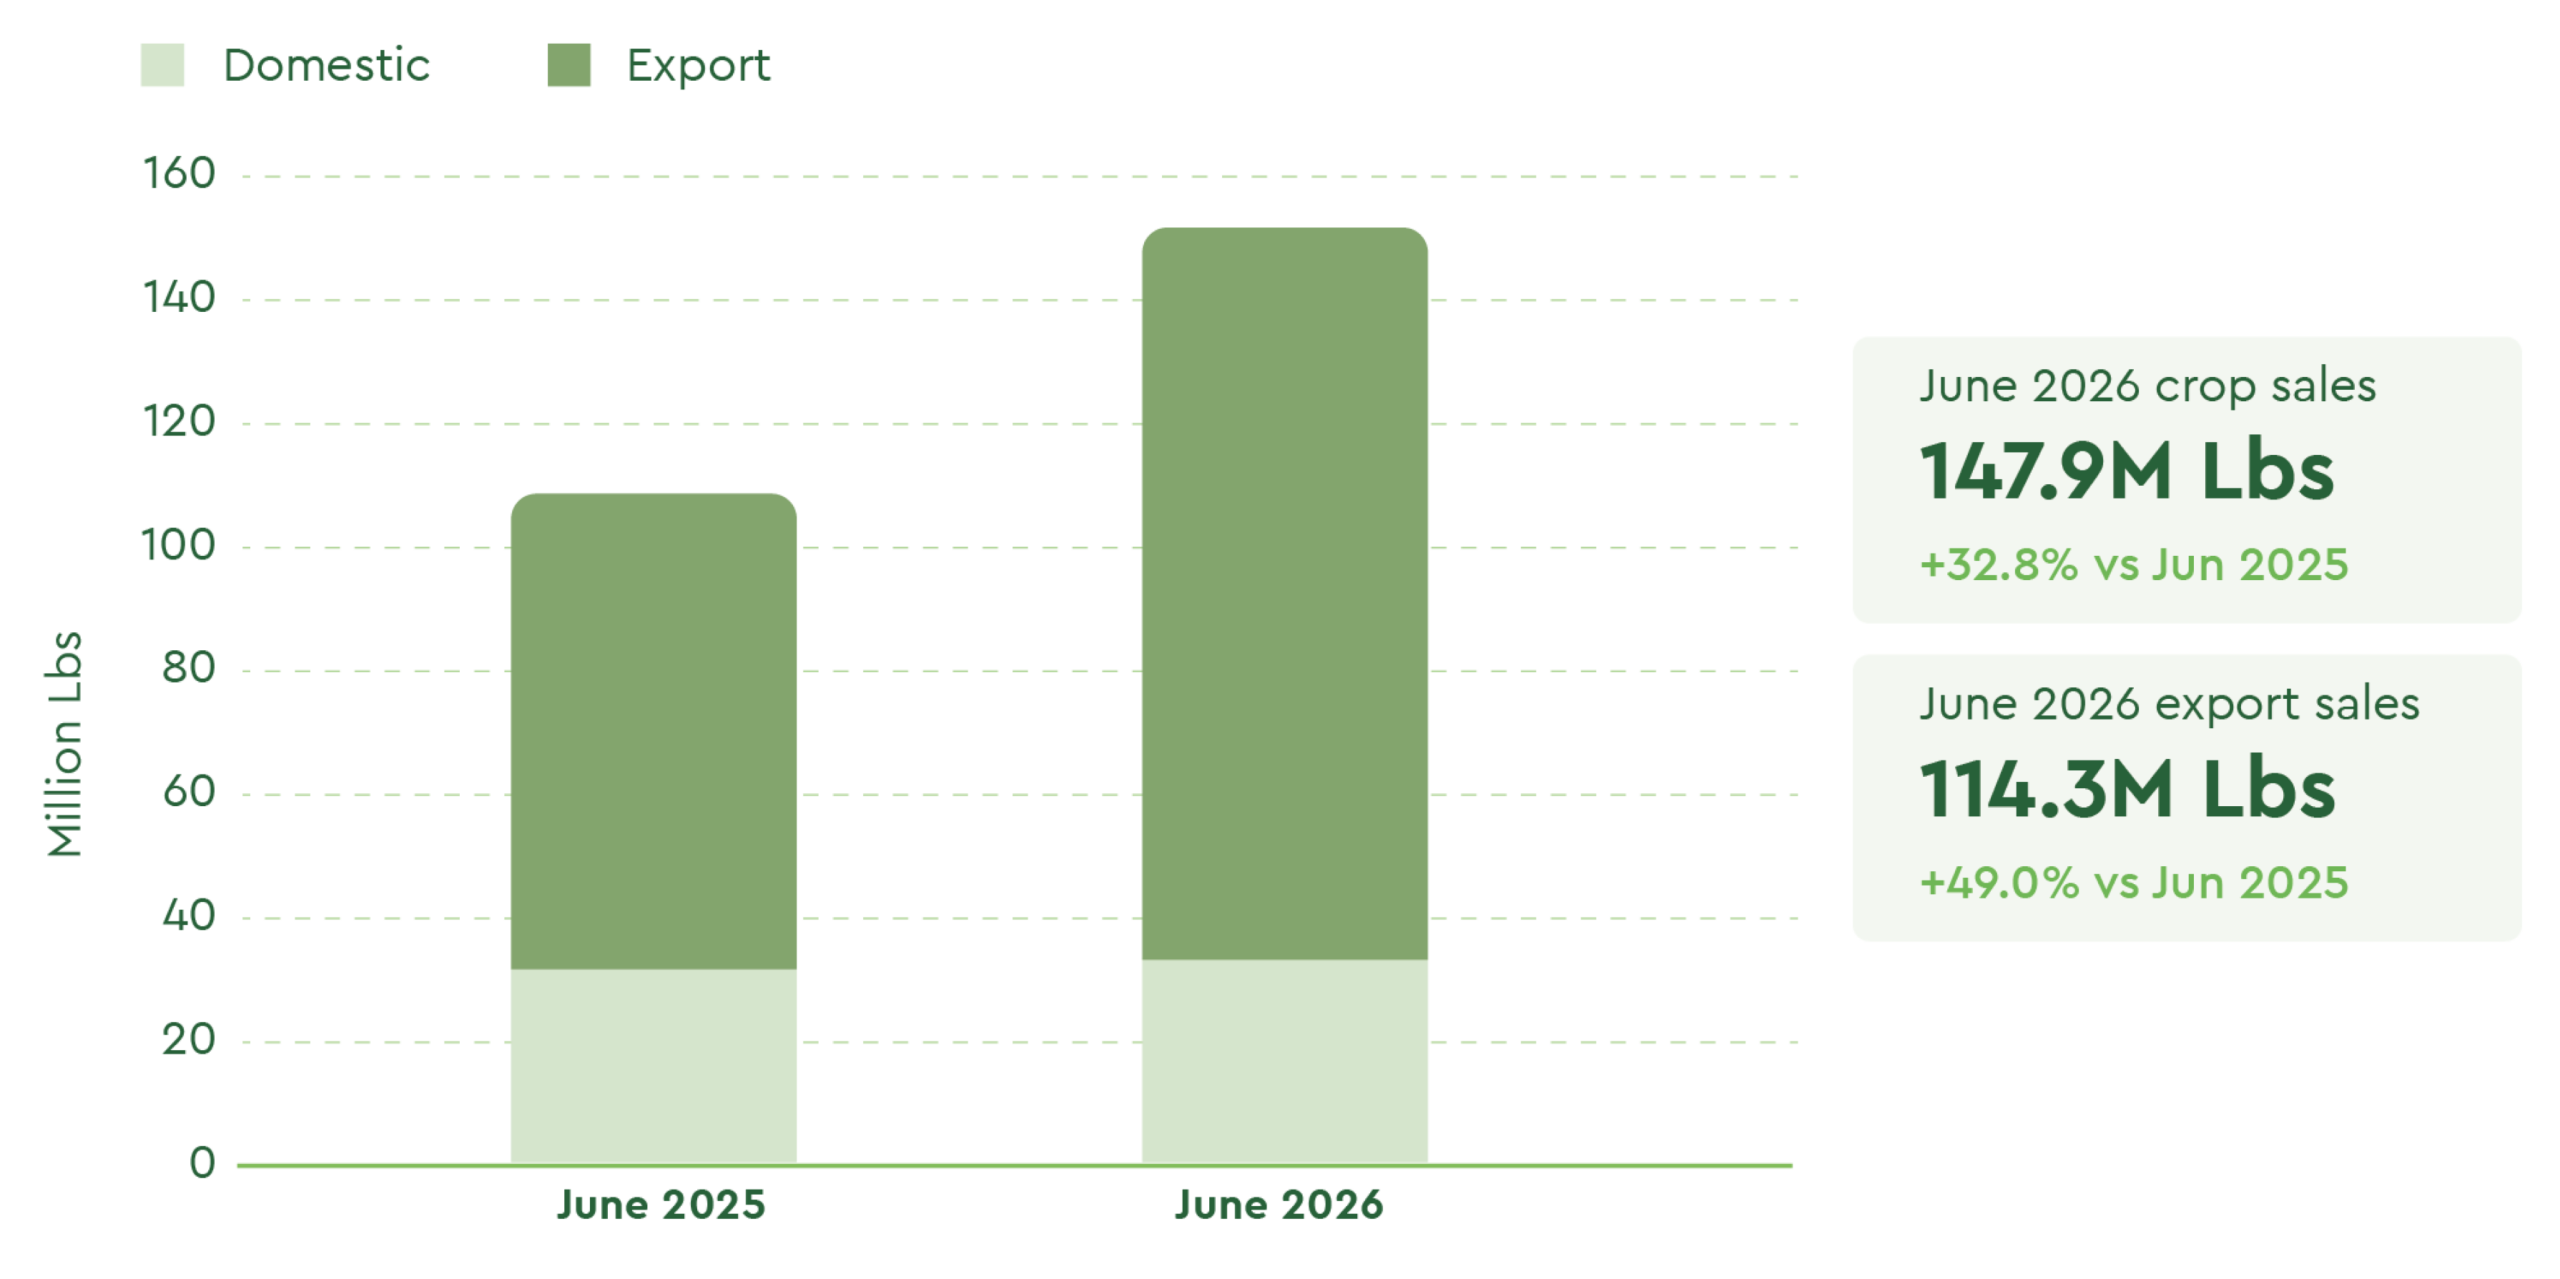
- June 2026 New Crop Sales: Totaled 147.9 million lbs (33.7M domestic / 114.3M export).
- June 2025 New Crop Sales: Stood at 111.4 million lbs (34.7M domestic / 76.7M export).
This +32.7% increase in new crop commitments highlights that buyers recognize current-crop inventories are incredibly tight, with specific sizes and grades highly elusive, and are actively securing new crops early to protect themselves.
The Emotional Landscape: Grower Confidence Returns
The mood among California almond growers is changing in a way we have not seen in years.
Growers believe this year’s harvest will be smaller than official forecasts. Independent reports support this view, including one from a major processing company that lowered its estimate to 2.67 billion pounds.
Farmers no longer feel forced to sell their crops quickly at low prices. Instead, Central Valley growers are confident enough to sell only what they must to pay their immediate bills.
They are keeping the rest of their almonds in storage, waiting to sell them at higher prices later.
There is a growing hope to return to the strong market of 2010 to 2015, when sellers had the power to set higher prices.
Regional U.S. Export Performance
- Europe (+12.8% in June): Driven heavily by Spain (18.1M lbs, up from 12.2M YoY). This region received a massive boost on July 1, 2026, with the announcement of a US-EU Trade Agreement establishing a 0% duty for the first 500,000 metric tons of US tree nuts.
- The Middle East (Resurgence & Hub Shift): Combined Middle East/Africa shipments surged +44.3% in June.
- Turkey continues to solidify its role as the region’s main trade hub, ending the month at 9.5M lbs and pacing +42% YTD.
- UAE successfully reopened, shipping 10.5 million lbs in June (up 27.6% YoY) after being largely sidelined for four months.
- India (Steady Powerhouse): 34.0 million lbs exported to India in June. While YTD is down slightly (-8.8%), this reflects tight current-crop inshell supply rather than dropping consumer demand. With Diwali falling late in 2026 (Nov 8) and very early in 2027 (Oct 29), the 2026 crop inshell will have to stretch across two consecutive holiday demand cycles.
Harvest 2026: Critical Pivot Points
The 2026 harvest is on track for an early start. Early orchards in California are expected to begin shaking between July 19–27, with harvest starting in earnest across the state by the first week of August.
- Quality: Quality is shaping up to be superior, with minimal insect and pest pressure reported so far.
- Sizing Warning: Multiple growing regions are reporting that kernel sizes appear to be running small. This could create severe premium pressure on larger grades and sizes once processing gets underway.
Harvest Outlook and Price Impact
Initial crop receipts of Nonpareil and Independence will be heavily scrutinized.
The Bullish Case (Short Crop Realized): If initial receipts confirm lighter loads, growers will pull back offers, liquidity will dry up, and a highly bullish environment will emerge. Because global buyers are highly uncovered for August–December shipments (with the exception of India), a rush to cover could drive a rapid, aggressive price spike.
The Bearish Case (Surprise Yields): If initial NP and Independence receipts surprise growers to the upside, growers will likely push front-end sales to capture current values. However, because global buyers have very thin coverage and grower momentum is high, any downward pressure on pricing is expected to be modest and temporary.
Recent Benchmarks (FAS Basis)
- Blanchable Variety Std 5: $3.03 FAS (Q4 Delivery)
- Cal SSR 25/27 AOL: $3.13 FAS (Prompt Delivery)
- Carmel type Sup 27/30 AOL: $3.22 FAS (Q4 Delivery)
- NPX 23/25 AOL: $3.64 FAS (September Delivery)
Final Thoughts on Strategic Procurement
July 2026 brings renewed confidence to the U.S. almond industry. While a massive panic price spike is unlikely, prices have hit a stable floor.
With prices currently stable, booking your supply for late 2026 and early 2027 is highly recommended. The risk of prices dropping further is minimal, while the potential for a price spike is significant.
Securing coverage on the front end allows buyers to enter the harvest season with a clear mind and insulated margins, rather than fighting a potentially fast-moving, rising market in September and October.
Reach out to the Private Label and sourcing specialists at Certified Origins to explore strategies to manage shifting trade dynamics and ensure the stability of your supply chain.
Almond Board of California Position Report (Released July 2026)
Land IQ Standing Acreage – Initial Estimate (Released April 23, 2026)

Share on


